 01
01Airlines
A connected view of services and teams helps respond to incidents while maintaining continuity. Track percentage of activities on time and average request resolution time.
↗
The same platform adapts to different business models. Each industry highlights measurable outcomes: cycle time, compliance, incidents and traceability.
01A connected view of services and teams helps respond to incidents while maintaining continuity. Track percentage of activities on time and average request resolution time.
↗ 02
02Connect services, resources and event tracking to respond sooner to disruption. Measure percentage of requests on time and incidents per 100 services.
↗ 03
03S-360 connects assets, teams and activities across energy and mining. Track percentage of maintenance on time, stoppages per 100 assets and percentage change in availability.
↗ 04
04Connect purchasing, stock, sales and service to reduce information gaps and delays. Measure percentage of deliveries on time and percentage change in service cycle time.
↗ 05
05S-360 connects requests, services and resources with traceability to control deadlines and reduce backlogs. Track percentage of cases on time and percentage change in response time.
↗ 06
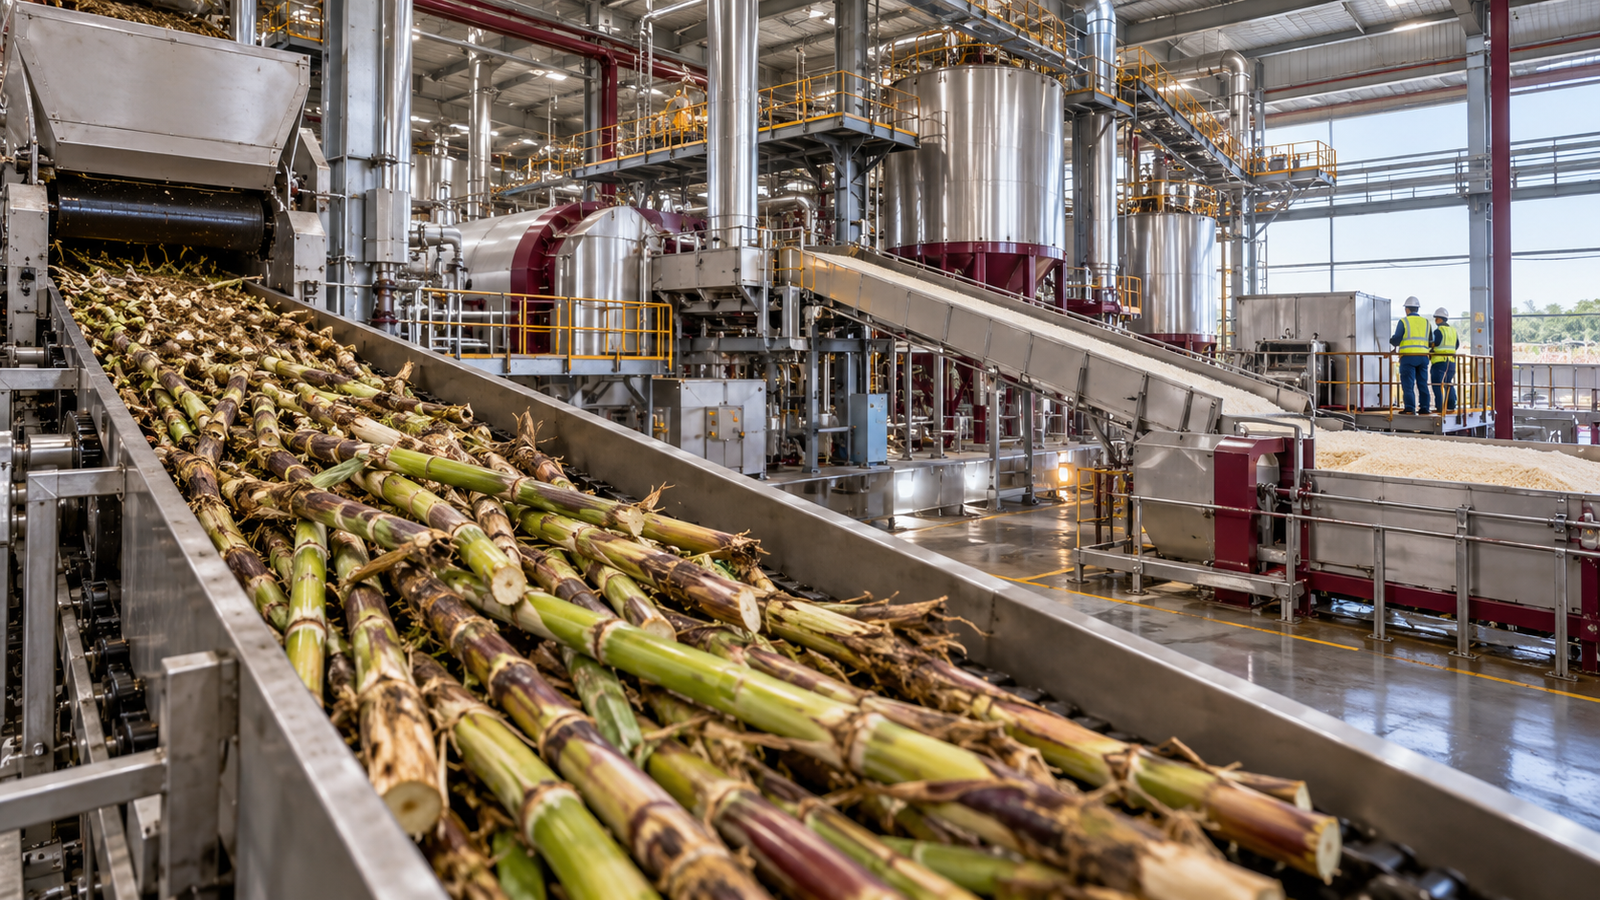
06Connect field operations, production, supply and dispatch to expose losses and delays. Track percentage of deliveries on time and percentage change in production cycle time.
↗ 07
07Connect services, staff, supplies and requests to reduce waiting and coordination risk with the controls each organization needs. Track percentage of cases on time and incidents per 100 cases.
↗We establish a baseline before configuring Integra360, then compare the same indicators after deployment. Targets are agreed with each client; percentages here illustrate the calculation, not promised outcomes.
Discover S-360 ↗S-360 can be configured for other business models. Let us review the processes, risks and indicators relevant to yours.