
Adapts to your company’s context, priorities and growth.
SMAGLOB / S-360
S-360. Your business connected in one platform.
S-360 is Smaglob’s integrated platform. Connect teams, run processes and analyze information in one place, configured for your business model and ready to evolve.

S-360 / S-360
Everything connected. Everything operated. Everything analyzed.
S-360 brings operations, services, people, purchasing, sales, payments and resources into one platform. Each deployment configures the capabilities and rules that fit the client’s business.
S-360 / S-360
Request a demo ↗Explore a possible S-360 view.
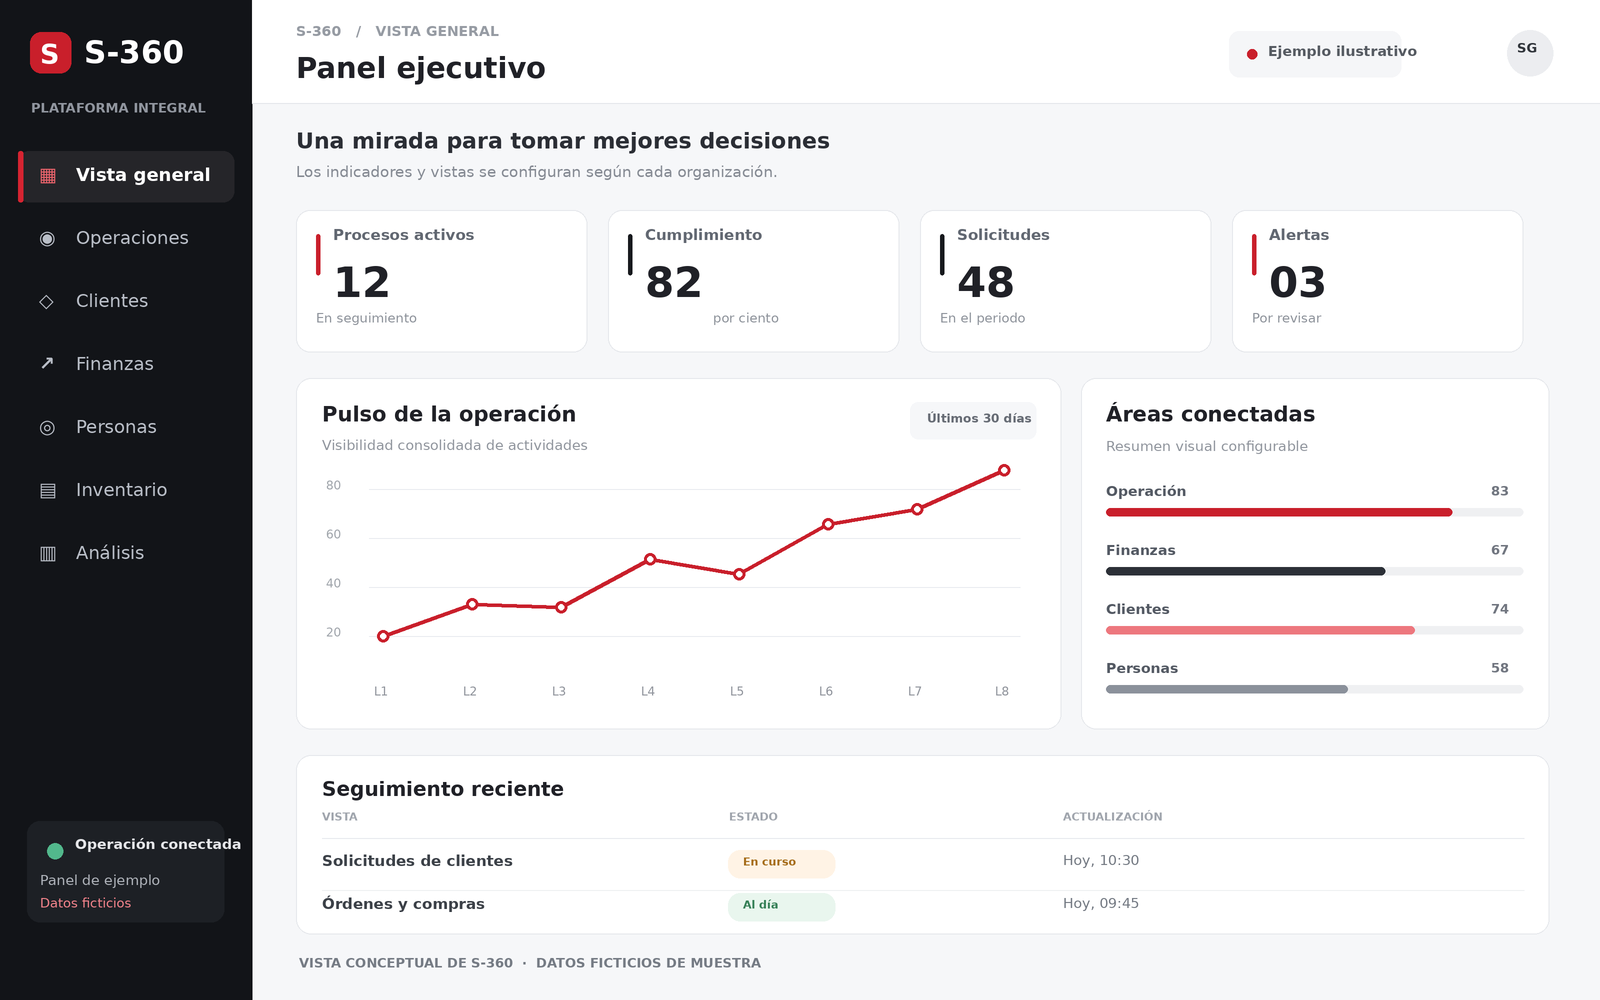
A visual example of connected operations in one place. Views, indicators and scope are configured for each organization.
01 / S-360
See your business as a whole.
Rather than looking at teams in isolation, S360 connects what happens across your organization. Follow activity, see what needs attention and act with better information.
Helps you gain a clearer view of your organization.
Supports new needs and opportunities.
02 / S-360
Configured for today. Ready for what comes next.
We start with S-360, an established platform, and configure the capabilities your organization needs. Its scope can grow and existing systems can be integrated subject to technical feasibility.
Our approach ↗
03 / S-360
Results measured with your own data.
We establish a baseline before configuring S-360, then compare the same indicators after deployment. Targets are agreed with each client; percentages here illustrate the calculation, not promised outcomes.
Illustrative example: 82 of 100 operations on time = 82 percent on-time completion.
On-time completion: cases on time ÷ total cases × 100.
Time saved: (baseline time − current time) ÷ baseline time × 100.
Risk: incidents per 100 operations and percentage of cases resolved.
04 / Industries
One view across the areas that drive your business.
The same platform adapts to different business models. Each industry highlights measurable outcomes: cycle time, compliance, incidents and traceability.
 01
01Airlines
A connected view of services and teams helps respond to incidents while maintaining continuity. Track percentage of activities on time and average request resolution time.
↗02Airports
Connect services, resources and event tracking to respond sooner to disruption. Measure percentage of requests on time and incidents per 100 services.
↗ 03
03Energy and mining
S-360 connects assets, teams and activities across energy and mining. Track percentage of maintenance on time, stoppages per 100 assets and percentage change in availability.
↗SMAGLOB / NEXT STEP
Let’s talk ↗